For a well-functioning application development team, it’s important to have the appropriate infrastructure behind, as a structured foundation. If the infrastructure is not supporting the application use-cases or the software development practices, it isn’t a good enough base for growth.
The monitoring and logging services are crucial, especially for a cloud environment and for a microservice architecture. Drawing the line between the 2 is very difficult and might depend on the application specifics but as a general rule, I think no application and its development team can operate efficiently if the logging infrastructure is not there.
Think about having a bug in production and having no logging infra? How can the engineers figure out what’s the problem? Well, it’s not impossible, it’s just very difficult and time-consuming.
Having a logging service is mandatory. However, adapting it to the application environment is just as critical as having it. One problem I see with the basic, tutorial based setups is the fact that they are just starting points and often the service is running with its default settings.
For example, let’s say you have an application running on Kubernetes. You want to have Kibana as a visualization tool for your logs. You just need a log collector, let’s use Fluentd. As soon as you set up the EFK – ElasticSearch, Fluentd, Kibana – stack, you can kick-start the project quickly because logs are going to flow in and Kibana will visualize it for you. So where’s the catch?
For normal, single lined log messages, this is going to work flawlessly. But any engineer who has seen a single exception already, knows that a stacktrace is a multiline log message. Single lines out of an exception trace doesn’t give an engineer much value during an investigation.
So, in this article I’m going to cover how to set up an EFK stack on Kubernetes with an example Java based Spring Boot application to support multiline log messages.
The log collection in K8S
There are different ways to collect logs from a Kubernetes cluster. You can:
- use sidecar containers
- have the application push the logs into the logging service directly
- deploy a log collector agent to each cluster node to collect the logs
I’m going to cover the 3rd option, having a dedicated agent running on the cluster nodes.
So the basic idea in this case is to utilize the Docker engine under Kubernetes. When you are logging from a container to standard out/error, Docker is simply going to store those logs on the filesystem in specific folders.
Since a pod consists of Docker containers, those containers are going to be scheduled on a concrete K8S node, hence its logs are going to be stored on the node’s filesystem.
When you have an agent application running on every cluster-node, you can easily set up some watching for those log files and when something new is coming up, like a new log line, you can simply collect it.
Fluentd is one agent that can work this way. The only thing left is to figure out a way to deploy the agent to every K8S node. Luckily, Kubernetes provides a feature like this, it’s called DaemonSet. When you set up a DaemonSet – which is very similar to a normal Deployment -, Kubernetes makes sure that an instance is going to be deployed to every (selectively some) cluster node, so we’re going to use Fluentd with a DaemonSet.
EFK stack
As an example, I’m going to use the EFK – ElasticSearch, Fluentd, Kibana – stack. Kibana is going to be the visualization tool for the logs, ElasticSearch will be the backbone of Kibana to store the logs. And Fluentd is something we discussed already.
Here’s a full, example descriptor for the EFK stack (too long to put it here).
I didn’t want to go into the details of the EFK stack because the post is not about the stack itself but about how to set up the multiline logging for Fluentd, so please forgive me if you expected a detailed explanation on it.
I’m going to use minikube to set up the stack locally, if you have a normal K8S cluster, that’s fine too.
Everything in the stack is self-contained so a very simple apply is enough
$ kubectl apply -f k8s/efk-stack.yaml
Wait a minute or so to have everything started. Note that the stack relies on a LoadBalancer service to expose the Kibana UI, so in case of minikube, you have to tunnel it:
$ minikube tunnel
Status:
        machine: minikube
        pid: 21440
        route: 10.96.0.0/12 -> 172.17.30.214
        minikube: Running
        services: [kibana]
    errors:
                minikube: no errors
                router: no errors
                loadbalancer emulator: no errors
To get the LoadBalancer IP, query the services via kubectl:
$ kubectl -n kube-logging get services
NAME            TYPE           CLUSTER-IP      EXTERNAL-IP     PORT(S)             AGE
elasticsearch   ClusterIP      None            <none>          9200/TCP,9300/TCP   2m31s
kibana          LoadBalancer   10.98.233.248   10.98.233.248   5601:31758/TCP      2m31s
We are looking for the external IP which in my case is 10.98.233.248.
Now, loading 10.98.233.248:5601 into the browser, the Kibana UI should open.
Let’s go for the “Explore on my own” option here and go to to Discover menu on the left-hand side.
Now we have to set up the index pattern, for now ElasticSearch will store it in logstash-<date> format, so we’re going to use the logstash-* pattern.
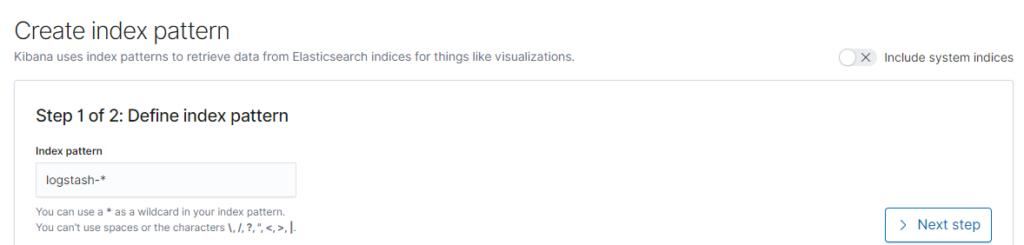
Click on Next step and then just select the @timestamp field and then Create index pattern.
Example Spring Boot application
Okay, the next thing is to have a realistic example, instead of just putting out a config for you without having an actual application for testing, let’s put together a Spring Boot application.
The main goal for this app is gonna be to have multiline logs on the standard output so we can test the logging setup.
As usual, I generated a project on Spring Initializr without any specific dependency.
The code is very simple, there are going to be 2 use-cases:
- The first one is when you use a logger to log a multiline message with explicit line breaks
- The second one is when you have an exception stacktrace in the logs
Here’s the code – I didn’t care about the best practices so everything is in the same class, don’t judge me:
@SpringBootApplication
@EnableScheduling
public class FluentdMultilineJavaApplication {
	private final static Logger log = LoggerFactory.getLogger(FluentdMultilineJavaApplication.class);

	@Autowired
	private ApplicationContext applicationContext;

	public static void main(String[] args) {
		SpringApplication.run(FluentdMultilineJavaApplication.class, args);
	}

	@Scheduled(fixedRate = 5000)
	public void log() {
		log.info("This is \na multiline\n\n\nlog");
	}

	private void m() {
	}

	@Scheduled(fixedRate = 10000)
	public void logException() {
		try {
			applicationContext.getBean("test");
		} catch (Exception e) {
			throw new RuntimeException("Error happened", e);
		}
	}
}
This will produce the following logs:
2020-10-08 21:45:31.676  INFO 23008 --- [   scheduling-1] .b.f.m.j.FluentdMultilineJavaApplication : This is
a multiline


log
2020-10-08 21:45:31.677 ERROR 23008 --- [   scheduling-1] o.s.s.s.TaskUtils$LoggingErrorHandler    : Unexpected error occurred in scheduled task

java.lang.RuntimeException: Error happened
	at com.arnoldgalovics.blog.fluentd.multiline.java.FluentdMultilineJavaApplication.logException(FluentdMultilineJavaApplication.java:40) ~[main/:na]
	at java.base/jdk.internal.reflect.NativeMethodAccessorImpl.invoke0(Native Method) ~[na:na]
	at java.base/jdk.internal.reflect.NativeMethodAccessorImpl.invoke(NativeMethodAccessorImpl.java:62) ~[na:na]
	at java.base/jdk.internal.reflect.DelegatingMethodAccessorImpl.invoke(DelegatingMethodAccessorImpl.java:43) ~[na:na]
	at java.base/java.lang.reflect.Method.invoke(Method.java:566) ~[na:na]
	at org.springframework.scheduling.support.ScheduledMethodRunnable.run(ScheduledMethodRunnable.java:84) ~[spring-context-5.2.9.RELEASE.jar:5.2.9.RELEASE]
	at org.springframework.scheduling.support.DelegatingErrorHandlingRunnable.run(DelegatingErrorHandlingRunnable.java:54) ~[spring-context-5.2.9.RELEASE.jar:5.2.9.RELEASE]
	at java.base/java.util.concurrent.Executors$RunnableAdapter.call(Executors.java:515) ~[na:na]
	at java.base/java.util.concurrent.FutureTask.runAndReset(FutureTask.java:305) ~[na:na]
	at java.base/java.util.concurrent.ScheduledThreadPoolExecutor$ScheduledFutureTask.run(ScheduledThreadPoolExecutor.java:305) ~[na:na]
	at java.base/java.util.concurrent.ThreadPoolExecutor.runWorker(ThreadPoolExecutor.java:1128) ~[na:na]
	at java.base/java.util.concurrent.ThreadPoolExecutor$Worker.run(ThreadPoolExecutor.java:628) ~[na:na]
	at java.base/java.lang.Thread.run(Thread.java:834) ~[na:na]
Caused by: org.springframework.beans.factory.NoSuchBeanDefinitionException: No bean named 'test' available
	at org.springframework.beans.factory.support.DefaultListableBeanFactory.getBeanDefinition(DefaultListableBeanFactory.java:816) ~[spring-beans-5.2.9.RELEASE.jar:5.2.9.RELEASE]
	at org.springframework.beans.factory.support.AbstractBeanFactory.getMergedLocalBeanDefinition(AbstractBeanFactory.java:1288) ~[spring-beans-5.2.9.RELEASE.jar:5.2.9.RELEASE]
	at org.springframework.beans.factory.support.AbstractBeanFactory.doGetBean(AbstractBeanFactory.java:298) ~[spring-beans-5.2.9.RELEASE.jar:5.2.9.RELEASE]
	at org.springframework.beans.factory.support.AbstractBeanFactory.getBean(AbstractBeanFactory.java:202) ~[spring-beans-5.2.9.RELEASE.jar:5.2.9.RELEASE]
	at org.springframework.context.support.AbstractApplicationContext.getBean(AbstractApplicationContext.java:1109) ~[spring-context-5.2.9.RELEASE.jar:5.2.9.RELEASE]
	at com.arnoldgalovics.blog.fluentd.multiline.java.FluentdMultilineJavaApplication.logException(FluentdMultilineJavaApplication.java:38) ~[main/:na]
	... 12 common frames omitted
Good, now let’s compile a minimalistic Dockerfile for the application:
FROM amazoncorretto:11-alpine-jdk
COPY build/libs/fluentd-multiline-java-0.0.1-SNAPSHOT.jar app.jar
ENTRYPOINT ["java","-jar","/app.jar"]
And then a K8S deployment descriptor:
apiVersion: v1
kind: Namespace
metadata:
  name: fluentd-test-ns
---
apiVersion: apps/v1
kind: Deployment
metadata:
  name: fluentd-multiline-java
  namespace: fluentd-test-ns
  labels:
    app: fluentd-multiline-java
spec:
  replicas: 1
  selector:
    matchLabels:
      app: fluentd-multiline-java
  template:
    metadata:
      labels:
        app: fluentd-multiline-java
    spec:
      containers:
        - name: fluentd-multiline-java
          image: fluentd-multiline-java:latest
          imagePullPolicy: IfNotPresent
Okay, we have everything for deploying the Spring Boot app to Kubernetes.
First of all, let’s build the JAR inside a container, and the final docker image. In case of minikube, I want to build it so the local cluster can access it:
$ eval $(minikube docker-env)
$ docker build -t fluentd-multiline-java:latest .
Last thing, deploy to K8S:
$ kubectl apply -f k8s/fluentd-multiline-java-deployment.yaml
namespace/fluentd-test-ns created
deployment.apps/fluentd-multiline-java created
Now let’s look at the logs:
$ kubectl -n fluentd-test-ns logs deployment/fluentd-multiline-java -f
Hopefully you see the same log messages as above, if not then you did not follow the steps. 🙂
Now if everything is working properly, if you go back to Kibana and open the Discover menu again, you should see the logs flowing in (I’m filtering for the fluentd-test-ns namespace).
And this is how a multiline log appears by default:
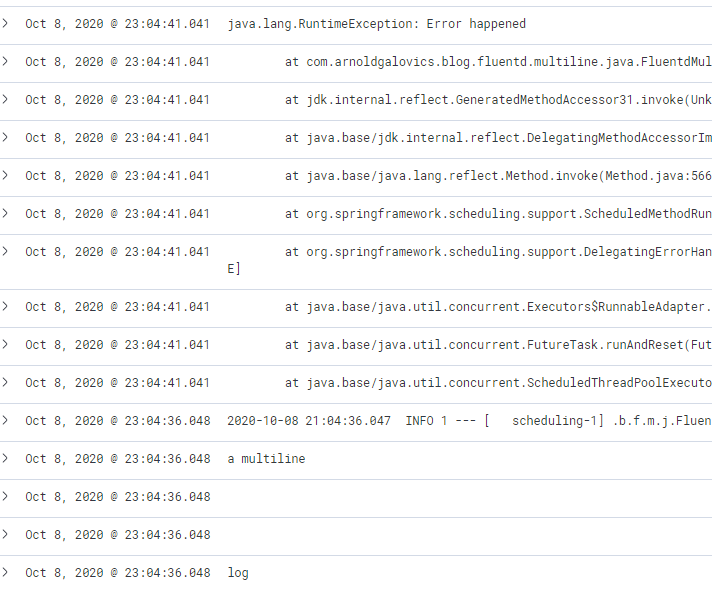
Not very neat, especially the stacktrace because every line is splitted into multiple records in Kibana. Searching with this setup is crazy difficult.
Multiline Fluentd support
Multiline support for the rescue. Fluentd has the capability to group multiline messages into one based on different rules.
If you start digging, mostly there are 5 solutions out there:
- the multiline parser
- the regex parser
- the GCP detect-exceptions plugin
- the concat filter plugin
- having the application log in a structured format like JSON
Here’s my take on them.
The GCP detect-exceptions plugin: great plugin if you want to group exceptions only for various languages, however normal multiline logs are not going to get grouped.
The regex parser: this will simply not work because of the nature how logs are getting into Fluentd. Don’t forget, all standard out log lines are stored for Docker containers on the filesystem and Fluentd is just watching the file. The regex parser operates on a single line, so grouping is not possible. At least I wasn’t able to do so.
The multiline parser: The most promising option. Even a Java example is included with the official documentation. The plugin can theoretically group multiple lines together with a regular expression, however I got the impression that in case of the Docker based JSON log, it simply doesn’t work. It could work if it reads directly from a standard output, but not from JSON based inputs. I spent quite some time experimenting with it but no luck.
The concat filter plugin: I didn’t give much chance to this plugin either since the multiline plugin wasn’t working but I eventually tried to make it work. After hours of reading and digging into the plugin internals, reading closed GitHub issues and so on, I was able to get it working, here’s how.
The plugin can concatenate the logs by having a regular expression specified that denotes the starting point for a multiline log like this config:
    <filter **>
      @type concat
      key log
      multiline_start_regexp /^(\d{4}-\d{1,2}-\d{1,2} \d{1,2}:\d{1,2}:\d{1,2}.\d{0,3})/
    </filter>
This fits to the Spring Boot pattern and this works. Kinda, until logs are continuously flowing into Fluentd. So how does the plugin know there’s an end of a multiline log? Well, it doesn’t. With this configuration, if there’s no log flowing in after the pattern is matching to the last message, it’s going to wait forever with sending the log message to Kibana, i.e. if the last log message is an exception stacktrace, it’s not going to show up until there’s a subsequent log that breaks the pattern.
So, back to the docs. There’s an option that seems like the one we need: flush_interval. According to the docs it specifies The number of seconds after which the last received event log will be flushed. If specified 0, wait for next line forever.
Let’s set it to 1 second, that should be enough for now.
   <filter **>
      @type concat
      key log
      multiline_start_regexp /^(\d{4}-\d{1,2}-\d{1,2} \d{1,2}:\d{1,2}:\d{1,2}.\d{0,3})/
      flush_interval 1
    </filter>
Sort of works, but not 100%. In Kibana, now some of the logs are appearing grouped but some are not even showing up.
So what’s going on? Well, it took me time to figure out but I had it. So when after the flushing interval, the plugin can’t determine if it’s the end of the multiline log (i.e. the case above), the plugin kind of turns that log message into an error because of the flush interval timeout.
In order to flow even the timed out messages into Kibana, we have to hack the configuration a little bit. We’ll rely on the labeling functionality of the plugin and then a relabeling plugin to redirect all events, even the error ones into the same output:
    <filter **>
      @type concat
      key log
      multiline_start_regexp /^(\d{4}-\d{1,2}-\d{1,2} \d{1,2}:\d{1,2}:\d{1,2}.\d{0,3})/
      flush_interval 1
      timeout_label "@NORMAL"
    </filter>
    <match **>
      @type relabel
      @label @NORMAL
    </match>
    <label @NORMAL>
        <match **>
            ...
        </match>
    </label>
First of all, the timeout_label setting specifies the label for error events, in this case @NORMAL. Then, the config is matching for everything and relabeling the events to @NORMAL so literally every event will have the same label applied.
Then, with the label directive, it’s filtering for the @NORMAL events and matching for everything. This way we can redirect the error events to the same output and everything will show up in the logs.
The fully working K8S config is here.
After the config modifications, just apply the EFK stack again:
$ kubectl apply -f k8s/efk-stack.yaml
namespace/kube-logging unchanged
service/elasticsearch unchanged
statefulset.apps/es-cluster configured
service/kibana unchanged
deployment.apps/kibana configured
serviceaccount/fluentd unchanged
clusterrole.rbac.authorization.k8s.io/fluentd unchanged
clusterrolebinding.rbac.authorization.k8s.io/fluentd unchanged
configmap/fluentd-config configured
daemonset.apps/fluentd unchanged
Now just restart the Fluentd pod:
$ kubectl -n kube-logging get pods | grep fluentd
fluentd-57v2f            1/1     Running   0          40m
$ kubectl -n kube-logging delete pod fluentd-57v2f
pod "fluentd-57v2f" deleted
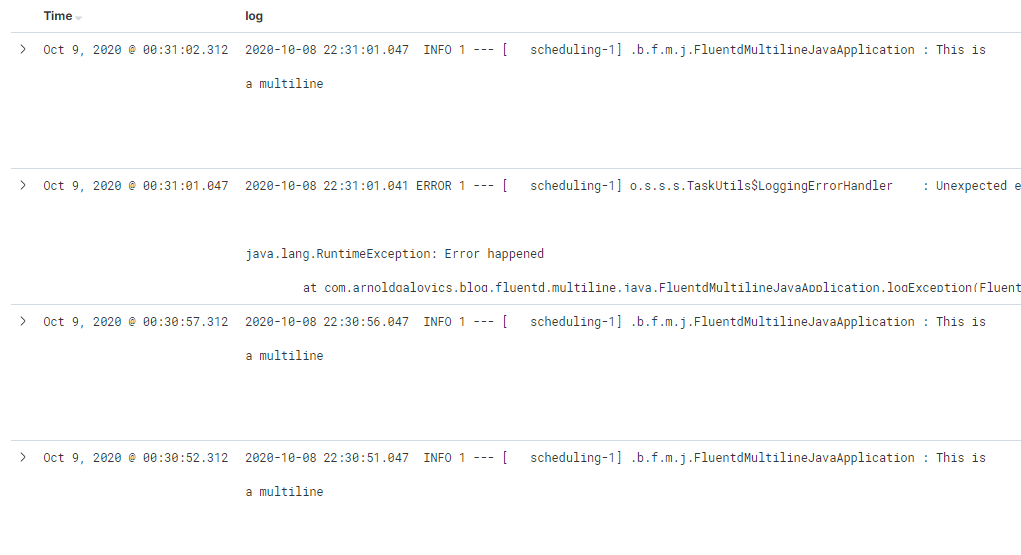
And now suddenly the result in Kibana will be a well-formatted, readable, searchable log stream.
Conclusion
The supporting infrastructure for an application is crucial. Logging is no different. If you lack proper logging support, engineers are going to have a really difficult time to do investigations effectively. Often, setting up K8S infrastructure comes with the challenge that multiline logs are not properly flowing into Kibana/Splunk/whatever visualization tool.
In the post, we’ve checked how the Fluentd configuration can be changed to feed the multiline logs properly. Small step for you, giant leap for the engineers working on the application.
As usual, if you enjoyed it, follow me on Twitter for more and the code is available here on GitHub.
Initial EFK stack descriptor
efk-stack.yaml
apiVersion: v1
kind: Namespace
metadata:
  name: kube-logging
---
kind: Service
apiVersion: v1
metadata:
  name: elasticsearch
  namespace: kube-logging
  labels:
    app: elasticsearch
spec:
  selector:
    app: elasticsearch
  clusterIP: None
  ports:
    - port: 9200
      name: rest
    - port: 9300
      name: inter-node
---
apiVersion: apps/v1
kind: StatefulSet
metadata:
  name: es-cluster
  namespace: kube-logging
spec:
  serviceName: elasticsearch
  replicas: 1
  selector:
    matchLabels:
      app: elasticsearch
  template:
    metadata:
      labels:
        app: elasticsearch
    spec:
      containers:
        - name: elasticsearch
          image: docker.elastic.co/elasticsearch/elasticsearch:7.2.0
          resources:
            limits:
              cpu: 1000m
            requests:
              cpu: 100m
          ports:
            - containerPort: 9200
              name: rest
              protocol: TCP
            - containerPort: 9300
              name: inter-node
              protocol: TCP
          volumeMounts:
            - name: data
              mountPath: /usr/share/elasticsearch/data
          env:
            - name: cluster.name
              value: k8s-logs
            - name: node.name
              valueFrom:
                fieldRef:
                  fieldPath: metadata.name
            - name: discovery.seed_hosts
              value: "es-cluster-0.elasticsearch"
            - name: cluster.initial_master_nodes
              value: "es-cluster-0"
            - name: ES_JAVA_OPTS
              value: "-Xms512m -Xmx512m"
      initContainers:
        - name: fix-permissions
          image: busybox
          command: ["sh", "-c", "chown -R 1000:1000 /usr/share/elasticsearch/data"]
          securityContext:
            privileged: true
          volumeMounts:
            - name: data
              mountPath: /usr/share/elasticsearch/data
        - name: increase-vm-max-map
          image: busybox
          command: ["sysctl", "-w", "vm.max_map_count=262144"]
          securityContext:
            privileged: true
        - name: increase-fd-ulimit
          image: busybox
          command: ["sh", "-c", "ulimit -n 65536"]
          securityContext:
            privileged: true
  volumeClaimTemplates:
    - metadata:
        name: data
        labels:
          app: elasticsearch
      spec:
        accessModes: [ "ReadWriteMany" ]
        resources:
          requests:
            storage: 10Gi
---
apiVersion: v1
kind: Service
metadata:
  name: kibana
  namespace: kube-logging
  labels:
    app: kibana
spec:
  ports:
    - port: 5601
  selector:
    app: kibana
  type: LoadBalancer
---
apiVersion: apps/v1
kind: Deployment
metadata:
  name: kibana
  namespace: kube-logging
  labels:
    app: kibana
spec:
  replicas: 1
  selector:
    matchLabels:
      app: kibana
  template:
    metadata:
      labels:
        app: kibana
    spec:
      containers:
        - name: kibana
          image: docker.elastic.co/kibana/kibana:7.2.0
          resources:
            limits:
              cpu: 1000m
            requests:
              cpu: 100m
          env:
            - name: ELASTICSEARCH_URL
              value: http://elasticsearch:9200
          ports:
            - containerPort: 5601
---
apiVersion: v1
kind: ServiceAccount
metadata:
  name: fluentd
  namespace: kube-logging
  labels:
    app: fluentd
---
apiVersion: rbac.authorization.k8s.io/v1
kind: ClusterRole
metadata:
  name: fluentd
  labels:
    app: fluentd
rules:
  - apiGroups:
      - ""
    resources:
      - pods
      - namespaces
    verbs:
      - get
      - list
      - watch
---
kind: ClusterRoleBinding
apiVersion: rbac.authorization.k8s.io/v1
metadata:
  name: fluentd
roleRef:
  kind: ClusterRole
  name: fluentd
  apiGroup: rbac.authorization.k8s.io
subjects:
  - kind: ServiceAccount
    name: fluentd
    namespace: kube-logging
---
apiVersion: v1
kind: ConfigMap
metadata:
  name: fluentd-config
  namespace: kube-logging
data:
  fluent.conf: |
    @include "#{ENV['FLUENTD_SYSTEMD_CONF'] || 'systemd'}.conf"
    @include "#{ENV['FLUENTD_PROMETHEUS_CONF'] || 'prometheus'}.conf"
    @include kubernetes.conf
    @include conf.d/*.conf
    <match **>
       @type elasticsearch
       @id out_es
       @log_level info
       include_tag_key true
       host "#{ENV['FLUENT_ELASTICSEARCH_HOST']}"
       port "#{ENV['FLUENT_ELASTICSEARCH_PORT']}"
       path "#{ENV['FLUENT_ELASTICSEARCH_PATH']}"
       scheme "#{ENV['FLUENT_ELASTICSEARCH_SCHEME'] || 'http'}"
       ssl_verify "#{ENV['FLUENT_ELASTICSEARCH_SSL_VERIFY'] || 'true'}"
       ssl_version "#{ENV['FLUENT_ELASTICSEARCH_SSL_VERSION'] || 'TLSv1'}"
       reload_connections "#{ENV['FLUENT_ELASTICSEARCH_RELOAD_CONNECTIONS'] || 'false'}"
       reconnect_on_error "#{ENV['FLUENT_ELASTICSEARCH_RECONNECT_ON_ERROR'] || 'true'}"
       reload_on_failure "#{ENV['FLUENT_ELASTICSEARCH_RELOAD_ON_FAILURE'] || 'true'}"
       log_es_400_reason "#{ENV['FLUENT_ELASTICSEARCH_LOG_ES_400_REASON'] || 'false'}"
       logstash_prefix "#{ENV['FLUENT_ELASTICSEARCH_LOGSTASH_PREFIX'] || 'logstash'}"
       logstash_format "#{ENV['FLUENT_ELASTICSEARCH_LOGSTASH_FORMAT'] || 'true'}"
       index_name "#{ENV['FLUENT_ELASTICSEARCH_LOGSTASH_INDEX_NAME'] || 'logstash'}"
       type_name "#{ENV['FLUENT_ELASTICSEARCH_LOGSTASH_TYPE_NAME'] || 'fluentd'}"
       <buffer>
         flush_thread_count "#{ENV['FLUENT_ELASTICSEARCH_BUFFER_FLUSH_THREAD_COUNT'] || '8'}"
         flush_interval "#{ENV['FLUENT_ELASTICSEARCH_BUFFER_FLUSH_INTERVAL'] || '5s'}"
         chunk_limit_size "#{ENV['FLUENT_ELASTICSEARCH_BUFFER_CHUNK_LIMIT_SIZE'] || '2M'}"
         queue_limit_length "#{ENV['FLUENT_ELASTICSEARCH_BUFFER_QUEUE_LIMIT_LENGTH'] || '32'}"
         retry_max_interval "#{ENV['FLUENT_ELASTICSEARCH_BUFFER_RETRY_MAX_INTERVAL'] || '30'}"
         retry_forever true
       </buffer>
    </match>
  kubernetes.conf: |
    <match fluent.**>
          @type null
    </match>
    <source>
      @type tail
      @id in_tail_container_logs
      path /var/log/containers/*.log
      pos_file /var/log/fluentd-containers.log.pos
      tag kubernetes.*
      read_from_head true
      <parse>
        @type "#{ENV['FLUENT_CONTAINER_TAIL_PARSER_TYPE'] || 'json'}"
        time_format %Y-%m-%dT%H:%M:%S.%NZ
      </parse>
    </source>
    <source>
      @type tail
      @id in_tail_minion
      path /var/log/salt/minion
      pos_file /var/log/fluentd-salt.pos
      tag salt
      <parse>
        @type regexp
        expression /^(?<time>[^ ]* [^ ,]*)[^\[]*\[[^\]]*\]\[(?<severity>[^ \]]*) *\] (?<message>.*)$/
        time_format %Y-%m-%d %H:%M:%S
      </parse>
    </source>
    <source>
      @type tail
      @id in_tail_startupscript
      path /var/log/startupscript.log
      pos_file /var/log/fluentd-startupscript.log.pos
      tag startupscript
      <parse>
        @type syslog
      </parse>
    </source>
    <source>
      @type tail
      @id in_tail_docker
      path /var/log/docker.log
      pos_file /var/log/fluentd-docker.log.pos
      tag docker
      <parse>
        @type regexp
        expression /^time="(?<time>[^)]*)" level=(?<severity>[^ ]*) msg="(?<message>[^"]*)"( err="(?<error>[^"]*)")?( statusCode=($<status_code>\d+))?/
      </parse>
    </source>
    <source>
      @type tail
      @id in_tail_etcd
      path /var/log/etcd.log
      pos_file /var/log/fluentd-etcd.log.pos
      tag etcd
      <parse>
        @type none
      </parse>
    </source>
    <source>
      @type tail
      @id in_tail_kubelet
      multiline_flush_interval 5s
      path /var/log/kubelet.log
      pos_file /var/log/fluentd-kubelet.log.pos
      tag kubelet
      <parse>
        @type kubernetes
      </parse>
    </source>
    <source>
      @type tail
      @id in_tail_kube_proxy
      multiline_flush_interval 5s
      path /var/log/kube-proxy.log
      pos_file /var/log/fluentd-kube-proxy.log.pos
      tag kube-proxy
      <parse>
        @type kubernetes
      </parse>
    </source>
    <source>
      @type tail
      @id in_tail_kube_apiserver
      multiline_flush_interval 5s
      path /var/log/kube-apiserver.log
      pos_file /var/log/fluentd-kube-apiserver.log.pos
      tag kube-apiserver
      <parse>
        @type kubernetes
      </parse>
    </source>
    <source>
      @type tail
      @id in_tail_kube_controller_manager
      multiline_flush_interval 5s
      path /var/log/kube-controller-manager.log
      pos_file /var/log/fluentd-kube-controller-manager.log.pos
      tag kube-controller-manager
      <parse>
        @type kubernetes
      </parse>
    </source>
    <source>
      @type tail
      @id in_tail_kube_scheduler
      multiline_flush_interval 5s
      path /var/log/kube-scheduler.log
      pos_file /var/log/fluentd-kube-scheduler.log.pos
      tag kube-scheduler
      <parse>
        @type kubernetes
      </parse>
    </source>
    <source>
      @type tail
      @id in_tail_rescheduler
      multiline_flush_interval 5s
      path /var/log/rescheduler.log
      pos_file /var/log/fluentd-rescheduler.log.pos
      tag rescheduler
      <parse>
        @type kubernetes
      </parse>
    </source>
    <source>
      @type tail
      @id in_tail_glbc
      multiline_flush_interval 5s
      path /var/log/glbc.log
      pos_file /var/log/fluentd-glbc.log.pos
      tag glbc
      <parse>
        @type kubernetes
      </parse>
    </source>
    <source>
      @type tail
      @id in_tail_cluster_autoscaler
      multiline_flush_interval 5s
      path /var/log/cluster-autoscaler.log
      pos_file /var/log/fluentd-cluster-autoscaler.log.pos
      tag cluster-autoscaler
      <parse>
        @type kubernetes
      </parse>
    </source>
    # Example:
    # 2017-02-09T00:15:57.992775796Z AUDIT: id="90c73c7c-97d6-4b65-9461-f94606ff825f" ip="104.132.1.72" method="GET" user="kubecfg" as="<self>" asgroups="<lookup>" namespace="default" uri="/api/v1/namespaces/default/pods"
    # 2017-02-09T00:15:57.993528822Z AUDIT: id="90c73c7c-97d6-4b65-9461-f94606ff825f" response="200"
    <source>
      @type tail
      @id in_tail_kube_apiserver_audit
      multiline_flush_interval 5s
      path /var/log/kubernetes/kube-apiserver-audit.log
      pos_file /var/log/kube-apiserver-audit.log.pos
      tag kube-apiserver-audit
      <parse>
        @type multiline
        format_firstline /^\S+\s+AUDIT:/
        # Fields must be explicitly captured by name to be parsed into the record.
        # Fields may not always be present, and order may change, so this just looks
        # for a list of key="\"quoted\" value" pairs separated by spaces.
        # Unknown fields are ignored.
        # Note: We can't separate query/response lines as format1/format2 because
        #       they don't always come one after the other for a given query.
        format1 /^(?<time>\S+) AUDIT:(?: (?:id="(?<id>(?:[^"\\]|\\.)*)"|ip="(?<ip>(?:[^"\\]|\\.)*)"|method="(?<method>(?:[^"\\]|\\.)*)"|user="(?<user>(?:[^"\\]|\\.)*)"|groups="(?<groups>(?:[^"\\]|\\.)*)"|as="(?<as>(?:[^"\\]|\\.)*)"|asgroups="(?<asgroups>(?:[^"\\]|\\.)*)"|namespace="(?<namespace>(?:[^"\\]|\\.)*)"|uri="(?<uri>(?:[^"\\]|\\.)*)"|response="(?<response>(?:[^"\\]|\\.)*)"|\w+="(?:[^"\\]|\\.)*"))*/
        time_format %Y-%m-%dT%T.%L%Z
      </parse>
    </source>
    <filter kubernetes.**>
      @type kubernetes_metadata
      @id filter_kube_metadata
    </filter>
  systemd.conf: |
    # Logs from systemd-journal for interesting services.
    <source>
      @type systemd
      @id in_systemd_kubelet
      matches [{ "_SYSTEMD_UNIT": "kubelet.service" }]
      <storage>
        @type local
        persistent true
        path /var/log/fluentd-journald-kubelet-cursor.json
      </storage>
      <entry>
        fields_strip_underscores true
      </entry>
      read_from_head true
      tag kubelet
    </source>
    # Logs from docker-systemd
    <source>
      @type systemd
      @id in_systemd_docker
      matches [{ "_SYSTEMD_UNIT": "docker.service" }]
      <storage>
        @type local
        persistent true
        path /var/log/fluentd-journald-docker-cursor.json
      </storage>
      <entry>
        fields_strip_underscores true
      </entry>
      read_from_head true
      tag docker.systemd
    </source>
    # Logs from systemd-journal for interesting services.
    <source>
      @type systemd
      @id in_systemd_bootkube
      matches [{ "_SYSTEMD_UNIT": "bootkube.service" }]
      <storage>
        @type local
        persistent true
        path /var/log/fluentd-journald-bootkube-cursor.json
      </storage>
      <entry>
        fields_strip_underscores true
      </entry>
      read_from_head true
      tag bootkube
    </source>
  prometheus.conf: |
    # Prometheus metric exposed on 0.0.0.0:24231/metrics
    <source>
      @type prometheus
      bind "#{ENV['FLUENTD_PROMETHEUS_BIND'] || '0.0.0.0'}"
      port "#{ENV['FLUENTD_PROMETHEUS_PORT'] || '24231'}"
      metrics_path "#{ENV['FLUENTD_PROMETHEUS_PATH'] || '/metrics'}"
    </source>
    <source>
      @type prometheus_output_monitor
    </source>
---
apiVersion: apps/v1
kind: DaemonSet
metadata:
  name: fluentd
  namespace: kube-logging
  labels:
    app: fluentd
spec:
  selector:
    matchLabels:
      app: fluentd
  template:
    metadata:
      labels:
        app: fluentd
    spec:
      serviceAccount: fluentd
      serviceAccountName: fluentd
      tolerations:
        - key: node-role.kubernetes.io/master
          effect: NoSchedule
      initContainers:
        - name: config-fluentd
          image: busybox
          imagePullPolicy: IfNotPresent
          command: ["/bin/sh","-c"]
          args:
            - cp /fluentd/etc2/fluent.conf /fluentd/etc/fluent.conf;cp /fluentd/etc2/systemd.conf /fluentd/etc/systemd.conf;cp /fluentd/etc2/kubernetes.conf /fluentd/etc/kubernetes.conf;cp /fluentd/etc2/prometheus.conf /fluentd/etc/prometheus.conf;
          volumeMounts:
            - name: config-path
              mountPath: /fluentd/etc
            - name: config-source
              mountPath: /fluentd/etc2
      containers:
        - name: fluentd
          image: fluent/fluentd-kubernetes-daemonset:v1.4.2-debian-elasticsearch-1.1
          env:
            - name:  FLUENT_ELASTICSEARCH_HOST
              value: "elasticsearch.kube-logging.svc.cluster.local"
            - name:  FLUENT_ELASTICSEARCH_PORT
              value: "9200"
            - name: FLUENT_ELASTICSEARCH_SCHEME
              value: "http"
            - name: FLUENTD_SYSTEMD_CONF
              value: disable
          resources:
            limits:
              memory: 512Mi
            requests:
              cpu: 100m
              memory: 200Mi
          volumeMounts:
            - name: varlog
              mountPath: /var/log
            - name: varlibdockercontainers
              mountPath: /var/lib/docker/containers
              readOnly: true
            - name: config-path
              mountPath: /fluentd/etc
      terminationGracePeriodSeconds: 30
      volumes:
        - name: varlog
          hostPath:
            path: /var/log
        - name: varlibdockercontainers
          hostPath:
            path: /var/lib/docker/containers
        - name: config-source
          configMap:
            name: fluentd-config
        - name: config-path
          emptyDir: {}
Hello, great article, well described, exactly what i needed. But please could you help with following:
as I used your config:
@type concat
key log
multiline_start_regexp /^(\d{4}-\d{1,2}-\d{1,2} \d{1,2}:\d{1,2}:\d{1,2}.\d{0,3})/
format /^(?\d{4}-\d{1,2}-\d{1,2} \d{1,2}:\d{1,2}:\d{1,2}.\d{0,3}) (?[A-Z]+) (?.*)/
flush_interval 1
timeout_label “@NORMAL”
@type relabel
@label @NORMAL
I added line with the “format” as I want to parse logs which are in one line. But it does not work.
Can you help with that ?
Hi Pavol. For sure I can help. Please open a new stackoverflow question so we can continue there instead. Thanks!
Hi Arnold Galovics,
My requirement is same as Pavol one. I want to parse the multiline log after concatenate and also single line log as well. same as this one – https://groups.google.com/g/fluentd/c/ejKQeZ2X224
Multilines are concatenated, and it showing single line logs & concatenated multiline logs as single line log. After this, I am trying to parse it to multiple fields using regexp parser. But its not working. Could you help with this?
Hi Arnold, great article, thank you for that!
I’m trying to get structured logs in kibana with your last mentioned method:
> having the application log in a structured format like JSON
This is pretty easy as Spring Boot / Logback provides the `LogstashEncoder` which logs messages in a structured way as json-documents (setup instructions for the spring boot at: https://cassiomolin.com/2019/06/30/log-aggregation-with-spring-boot-elastic-stack-and-docker/#logging-in-json-format).
Unfortunately Kibana still shows the json-documents as a whole string and don’t split the json into keys and values. As I’m not an expert of the EFK-stack I can only believe that fluentd is missing a special configuration?!
I’m asking if you are interested in investigating some time into the structured log messages approach?
Best regards,
Clemens
Hi Clemens, sure I’m happy to help. If you don’t mind, let’s post your question on stackoverflow to continue the discussion.
Can we do same without K8S. My Fluentd is running in docker container
Hi Khan. Absolutely, running it in plain docker is just as fine as running everything in K8S. In that case you gotta do the fluentd configuration in your custom docker image if any, or when you are running the container. The configuration is here: https://github.com/galovics/fluentd-multiline-java/blob/master/k8s/efk-stack.yaml#L189
you can pls upload fluentd config file? what need to put here?
…
Hi Nurlan, the fluentd config is here as mentioned at the end of the article: https://github.com/galovics/fluentd-multiline-java/blob/master/k8s/efk-stack.yaml#L189
Hope that helps!
Pretty! This was a really wonderful article. Many thanks for providing these details. Ulrica Kyle Kassab
Hey Arnold, great article!
Have you tried to implement this using logging-operator?
Thanks!
Unfortunately the plugin doesn’t return detected fields with multiline stack trace.
hello, i use your config
@type concat
key log
multiline_start_regexp /^(\d{4}-\d{1,2}-\d{1,2} \d{1,2}:\d{1,2}:\d{1,2}[\.|,]\d{3})/
flush_interval 1
separator “\n”
timeout_label “@NORMAL”
, the concat plugin worked but the kibana show the stacktrace with one line